
Welcome to our comprehensive guide on Japanese Candlestick Trading Strategies. We will explore the fascinating world of Japanese candlestick charts and their application in the field of trading. Candlestick charts originated in Japan in the 18th century and have since become a popular tool among traders worldwide.
Japanese candlestick charts provide valuable insights into price movements, helping traders identify trends, reversals, and potential trading opportunities. By understanding different candlestick patterns and their meanings, traders can make informed decisions and improve their chances of success in the financial markets.
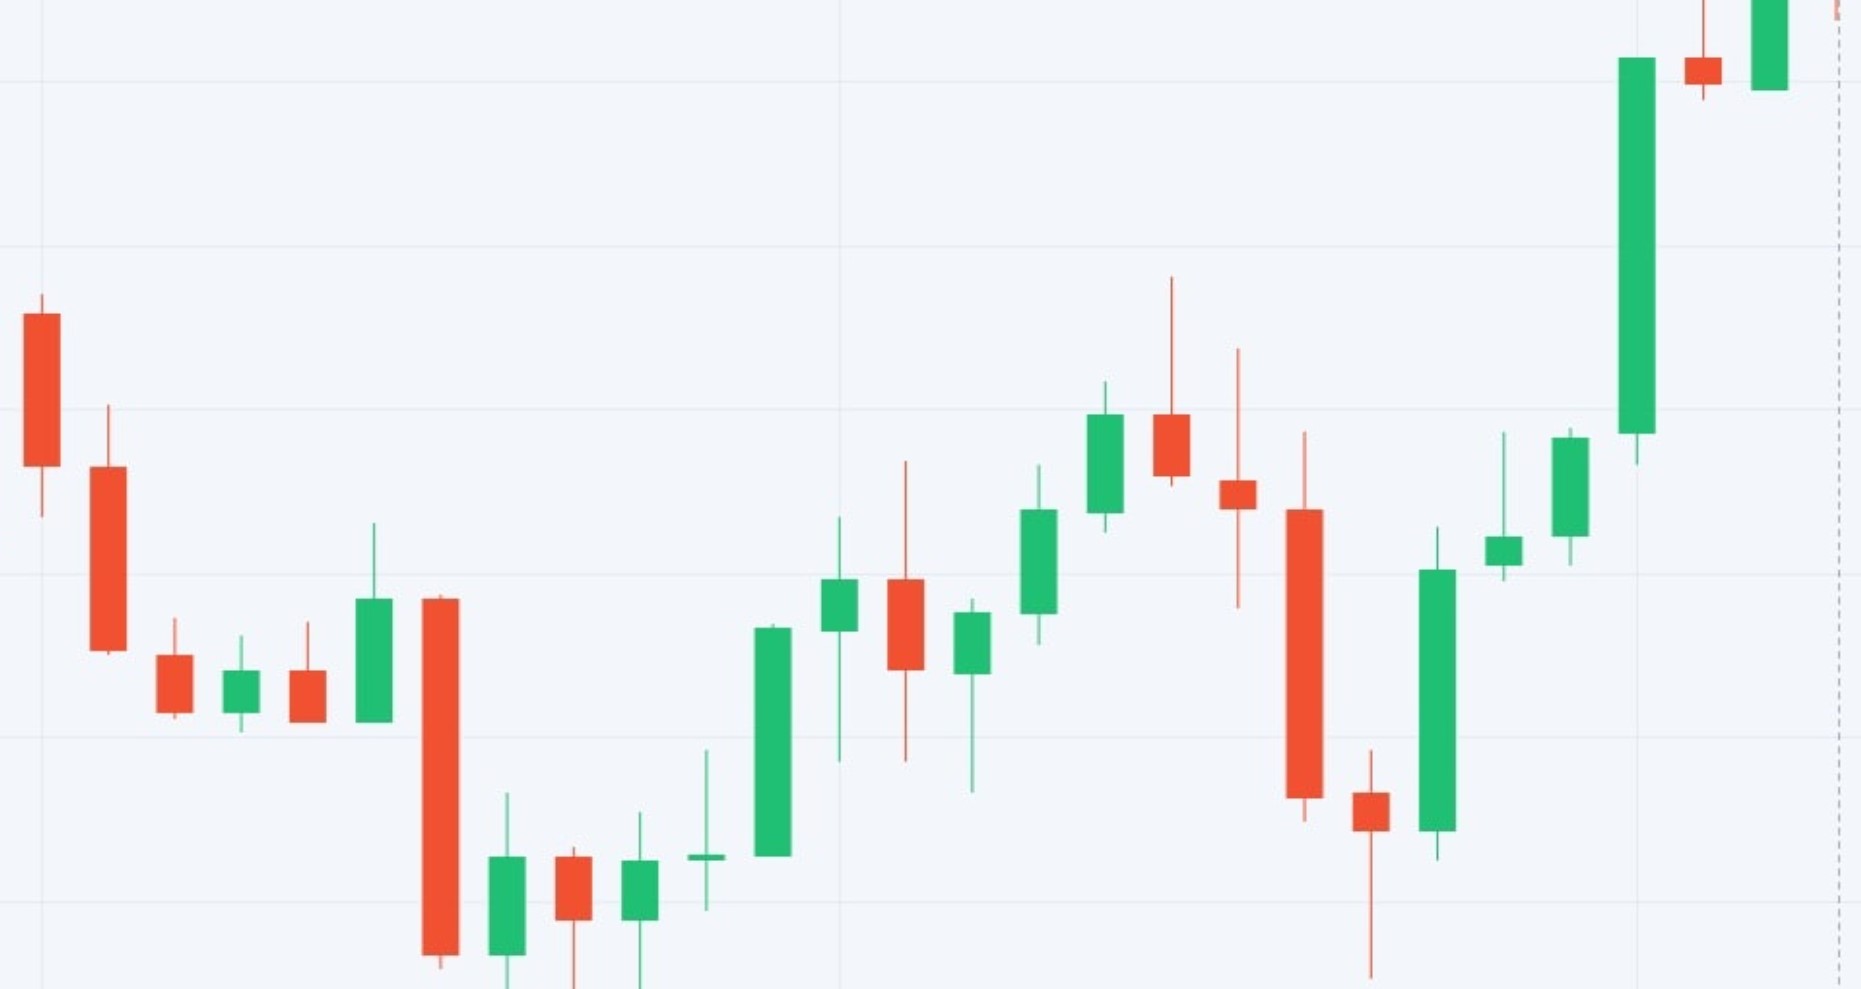
Japanese Candlestick: Strategies
Japanese Candlestick Trading Strategies encompass a wide range of techniques that traders use to analyze candlestick patterns and make trading decisions. By combining various candlestick patterns with other technical indicators and tools, traders can gain a deeper understanding of market dynamics and identify profitable trading opportunities. Let’s delve into some of the most effective Japanese Candlestick Trading Strategies:
1. Bullish Engulfing Pattern
The Bullish Engulfing Pattern is a two-candlestick pattern that indicates a potential reversal from a downtrend to an uptrend. It occurs when a small bearish candle is followed by a larger bullish candle that completely engulfs the previous candle’s body. Traders often interpret this pattern as a sign of bullish sentiment and consider it a buying opportunity.
2. Bearish Harami Pattern
The Bearish Harami Pattern is a two-candlestick pattern that suggests a potential reversal from an uptrend to a downtrend. It consists of a large bullish candle followed by a small bearish candle that is completely engulfed within the previous candle’s body. This pattern indicates a weakening of bullish momentum and can be a signal for traders to consider selling or taking short positions.
3. Doji Pattern
The Doji Pattern is a single candlestick pattern that represents indecision in the market. It occurs when the opening and closing prices are very close or identical, resulting in a small or no real body. The Doji Pattern suggests that buyers and sellers are in equilibrium, and a potential reversal or trend continuation may occur. Traders often look for confirmation from other technical indicators before making trading decisions based on this pattern.
4. Hammer Pattern
The Hammer Pattern is a single candlestick pattern that has a small real body and a long lower shadow. It usually forms after a downtrend and suggests a potential trend reversal to the upside. The long lower shadow indicates that sellers pushed the price lower, but buyers managed to regain control, driving the price back up. Traders often see this pattern as a bullish signal.
5. Shooting Star Pattern
The Shooting Star Pattern is a single candlestick pattern that has a small real body and a long upper shadow. It typically forms after an uptrend and suggests a potential reversal to the downside. The long upper shadow indicates that buyers pushed the price higher, but sellers entered the market and pushed the price back down. Traders often interpret this pattern as a bearish signal.
6. Three Black Crows Pattern
The Three Black Crows Pattern is a bearish reversal pattern that consists of three consecutive long-bodied bearish candles. Each candle opens higher than the previous day’s open and closes lower than the previous day’s close, forming a downward trend. This pattern indicates a strong selling pressure and can be a signal for traders to consider short positions or exiting long positions.
7. Three White Soldiers Pattern
The Three White Soldiers Pattern is a bullish reversal pattern that consists of three consecutive long-bodied bullish candles. Each candle opens lower than the previous day’s open and closes higher than the previous day’s close, forming an upward trend. This pattern indicates a strong buying pressure and can be a signal for traders to consider long positions or exiting short positions.
8. Morning Star Pattern
The Morning Star Pattern is a three-candlestick pattern that suggests a potential reversal from a downtrend to an uptrend. It consists of a large bearish candle followed by a small bullish or bearish candle, and finally, a large bullish candle. The small middle candle represents a period of indecision, and the large bullish candle confirms the reversal. Traders often consider this pattern a bullish signal.
9. Evening Star Pattern
The Evening Star Pattern is a three-candlestick pattern that suggests a potential reversal from an uptrend to a downtrend. It consists of a large bullish candle followed by a small bullish or bearish candle, and finally, a large bearish candle. The small middle candle represents a period of indecision, and the large bearish candle confirms the reversal. Traders often see this pattern as a bearish signal.
10. Tweezer Tops and Bottoms
Tweezer Tops and Bottoms are two-candlestick patterns that indicate potential reversals in the market. Tweezer Tops occur when two consecutive candles have identical highs, suggesting a potential resistance level. Tweezer Bottoms occur when two consecutive candles have identical lows, indicating a potential support level. Traders often monitor these patterns for possible trend reversals or continuation.
FAQs
- What are Japanese Candlestick Trading Strategies? Japanese Candlestick Trading Strategies are techniques that traders use to analyze candlestick patterns and make trading decisions. By understanding different candlestick patterns and their meanings, traders can enhance their trading skills and increase their chances of success in the financial markets.
- How do Japanese candlestick charts work? Japanese candlestick charts represent price movements over a specific period. Each candlestick consists of a body and shadows (upper and lower). The body represents the opening and closing prices, while the shadows show the high and low prices during the period. Traders analyze the patterns formed by candlesticks to identify market trends and potential trading opportunities.
- What is the significance of candlestick patterns in trading? Candlestick patterns provide valuable insights into market sentiment and help traders identify potential reversals, trend continuations, and consolidation periods. By recognizing and understanding these patterns, traders can make informed decisions and improve their timing and accuracy in executing trades.
- Can candlestick patterns be used in combination with other technical indicators? Yes, traders often combine candlestick patterns with other technical indicators and tools to confirm trading signals. Popular technical indicators used in conjunction with candlestick patterns include moving averages, oscillators, and trend lines. The combination of multiple indicators can provide a more comprehensive analysis of the market.
- Are candlestick patterns effective for all financial markets? Candlestick patterns can be applied to various financial markets, including stocks, commodities, forex, and cryptocurrencies. However, it’s important to consider the specific characteristics and dynamics of each market when using candlestick patterns. Traders should also adapt their strategies based on the timeframes they are trading and the volatility of the market.