
Technical analysis plays a vital role in understanding price movements and making informed decisions. Among the many tools available, Fibonacci retracement and extension levels have emerged as popular techniques used by traders and investors alike. These levels, based on the Fibonacci sequence, provide valuable insights into potential support, resistance, and price targets.
We will explore Fibonacci retracement and extension levels in detail, uncovering their significance and practical application. From understanding the basics to implementing these levels in your trading strategies, we’ll equip you with the knowledge and expertise to harness the power of Fibonacci in your financial endeavors.
Fibonacci Retracement and Extension Levels
The Fibonacci retracement and extension levels are based on the mathematical sequence discovered by the renowned Italian mathematician Leonardo Fibonacci in the 13th century. This sequence, known as the Fibonacci sequence, begins with 0 and 1 and is formed by adding the previous two numbers to get the next number. The sequence looks like this: 0, 1, 1, 2, 3, 5, 8, 13, 21, 34, and so on.
These numbers possess unique mathematical properties and have found their way into various fields, including finance and technical analysis. Traders and analysts have identified key ratios within the Fibonacci sequence that hold significant importance in market behavior. The most commonly used ratios are 0.382, 0.500, 0.618, 0.786, and 0.886.
The Basics of Fibonacci Retracement
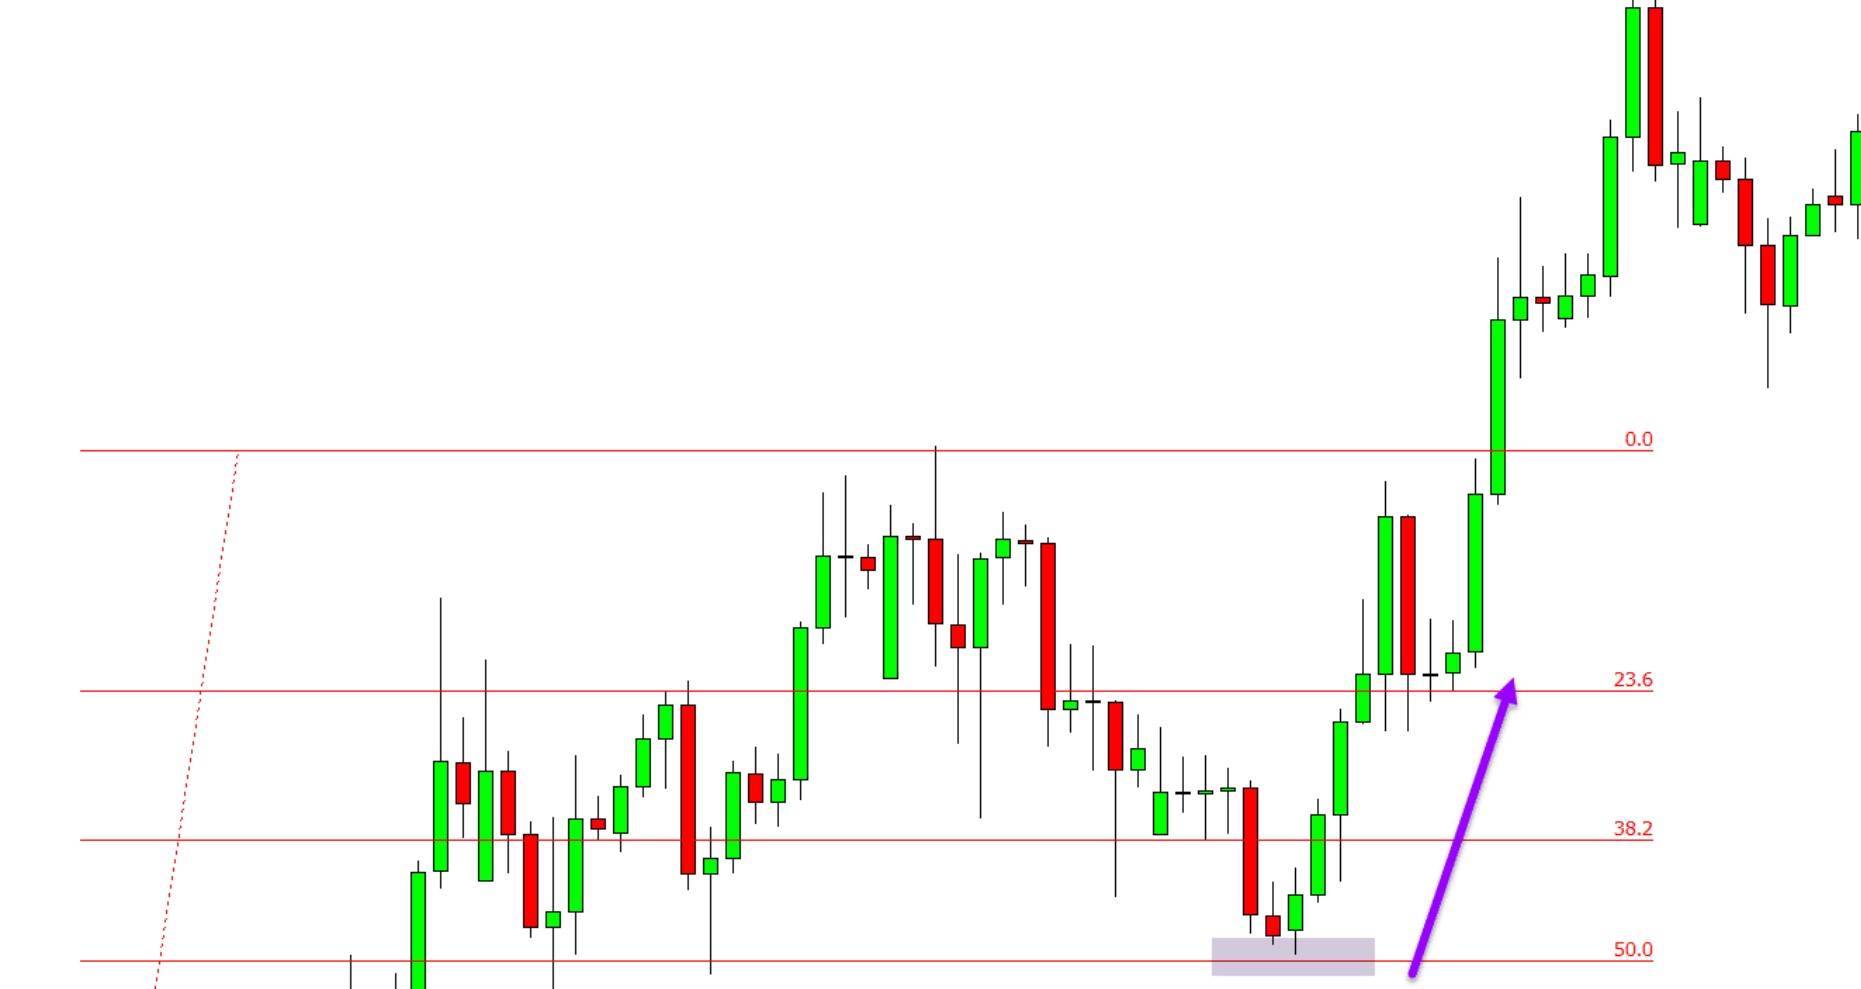
Fibonacci retracement is a technique used to identify potential levels of support and resistance in a price chart. Traders use this tool to determine where a price correction might end and the original trend could resume. The Fibonacci retracement levels are plotted by drawing horizontal lines at the key ratios mentioned earlier, namely 38.2%, 50%, and 61.8%.
When a market experiences a significant price move, whether up or down, traders can apply Fibonacci retracement levels to gauge potential levels of retracement. The idea is to identify areas where the price is likely to reverse and resume its original direction. By doing so, traders can time their entries and exits more effectively, improving their chances of making profitable trades.
Applying Fibonacci Retracement in Trading Strategies
To effectively utilize Fibonacci retracement levels, traders follow a simple process:
- Identify a significant price move – Look for a clear and substantial trend in the price chart.
- Draw the Fibonacci retracement levels – Locate the highest and lowest points of the trend and draw the retracement levels using the Fibonacci ratios (38.2%, 50%, and 61.8%).
- Determine potential reversal zones – These zones are where the price is likely to find support or resistance. They indicate potential areas to enter or exit trades.
- Combine Fibonacci retracement with other technical tools – Enhance your analysis by incorporating other indicators, such as trendlines, moving averages, or oscillators, to confirm potential trade setups.
Understanding Fibonacci Extension Levels
While Fibonacci retracement levels help identify potential areas of retracement, Fibonacci extension levels assist in determining future price targets once a trend resumes. These levels extend beyond the initial price move and provide insights into where the price could reach in the future. The most commonly used Fibonacci extension levels are 1.272, 1.382, 1.618, and 2.618.
Traders use Fibonacci extension levels to set profit targets or identify areas where the price could encounter significant resistance or support. By doing so, they can make informed decisions on when to exit a trade or consider entering new positions.
Incorporating Fibonacci Extension Levels in Trading
To effectively use Fibonacci extension levels, traders follow these steps:
- Identify a significant price move – Look for a strong trend and determine the beginning and end points of the move.
- Draw the Fibonacci extension levels – Connect the initial price move with the extension levels (1.272, 1.382, 1.618, and 2.618).
- Determine potential price targets – These targets indicate areas where the price could encounter resistance or support. Traders can use them to set profit targets or adjust their stop-loss levels.
The Power of Fibonacci: Real-Life Examples
Let’s examine a few real-life examples to illustrate the practical application of Fibonacci retracement and extension levels:
- Example 1: Bullish Trend Reversal
- Scenario: A stock has been in a strong uptrend but recently experienced a correction.
- Action: A trader applies Fibonacci retracement levels to the price move from the low to high of the trend.
- Result: The trader identifies the 61.8% retracement level as a potential area of support. If the price bounces off this level, it suggests the uptrend might continue, presenting a buying opportunity.
- Example 2: Bearish Trend Extension
- Scenario: A currency pair is in a downtrend and has retraced to a certain level.
- Action: A trader applies Fibonacci extension levels to the previous price move to identify potential areas of resistance.
- Result: The trader discovers that the 1.272 extension level aligns with a significant historical resistance level. This confluence strengthens the case for a potential reversal, indicating an opportunity to enter short positions.
FAQs
- What is the significance of Fibonacci retracement levels in technical analysis? Fibonacci retracement levels provide traders with potential areas of support and resistance, aiding in decision-making for trade entries and exits.
- Are Fibonacci retracement and extension levels effective in all markets? Fibonacci levels can be applied to various financial markets, including stocks, currencies, commodities, and indices.
- Can Fibonacci retracement levels be used in conjunction with other technical indicators? Yes, traders often combine Fibonacci retracement levels with other tools such as trendlines, moving averages, or oscillators to validate potential trade setups.
- Do Fibonacci extension levels guarantee precise price targets? While Fibonacci extension levels indicate potential areas of resistance or support, they do not guarantee exact price targets. Traders should consider them as potential levels of interest.
- Can Fibonacci levels be used for short-term trading? Yes, Fibonacci retracement and extension levels can be applied to short-term trading strategies, such as scalping or day trading.
- Do Fibonacci levels work in volatile markets? Fibonacci levels can be effective in both volatile and stable markets, but it’s important to consider market conditions and use additional indicators for confirmation.
Derivation
Fibonacci retracement and extension levels are valuable tools in the arsenal of technical analysts. By understanding and applying these levels, traders gain insights into potential support, resistance, and price targets. Whether you’re a beginner or an experienced trader, incorporating Fibonacci into your analysis can enhance your decision-making process and improve your trading results.