
Welcome to the ultimate guide on Bollinger Bands, a powerful technical analysis tool that has revolutionized the way traders approach the financial markets. In this comprehensive guide, we will delve into the intricacies of Bollinger Bands, exploring their origins, applications, and strategies for traders to capitalize on their potential.
Conception Bollinger Bands
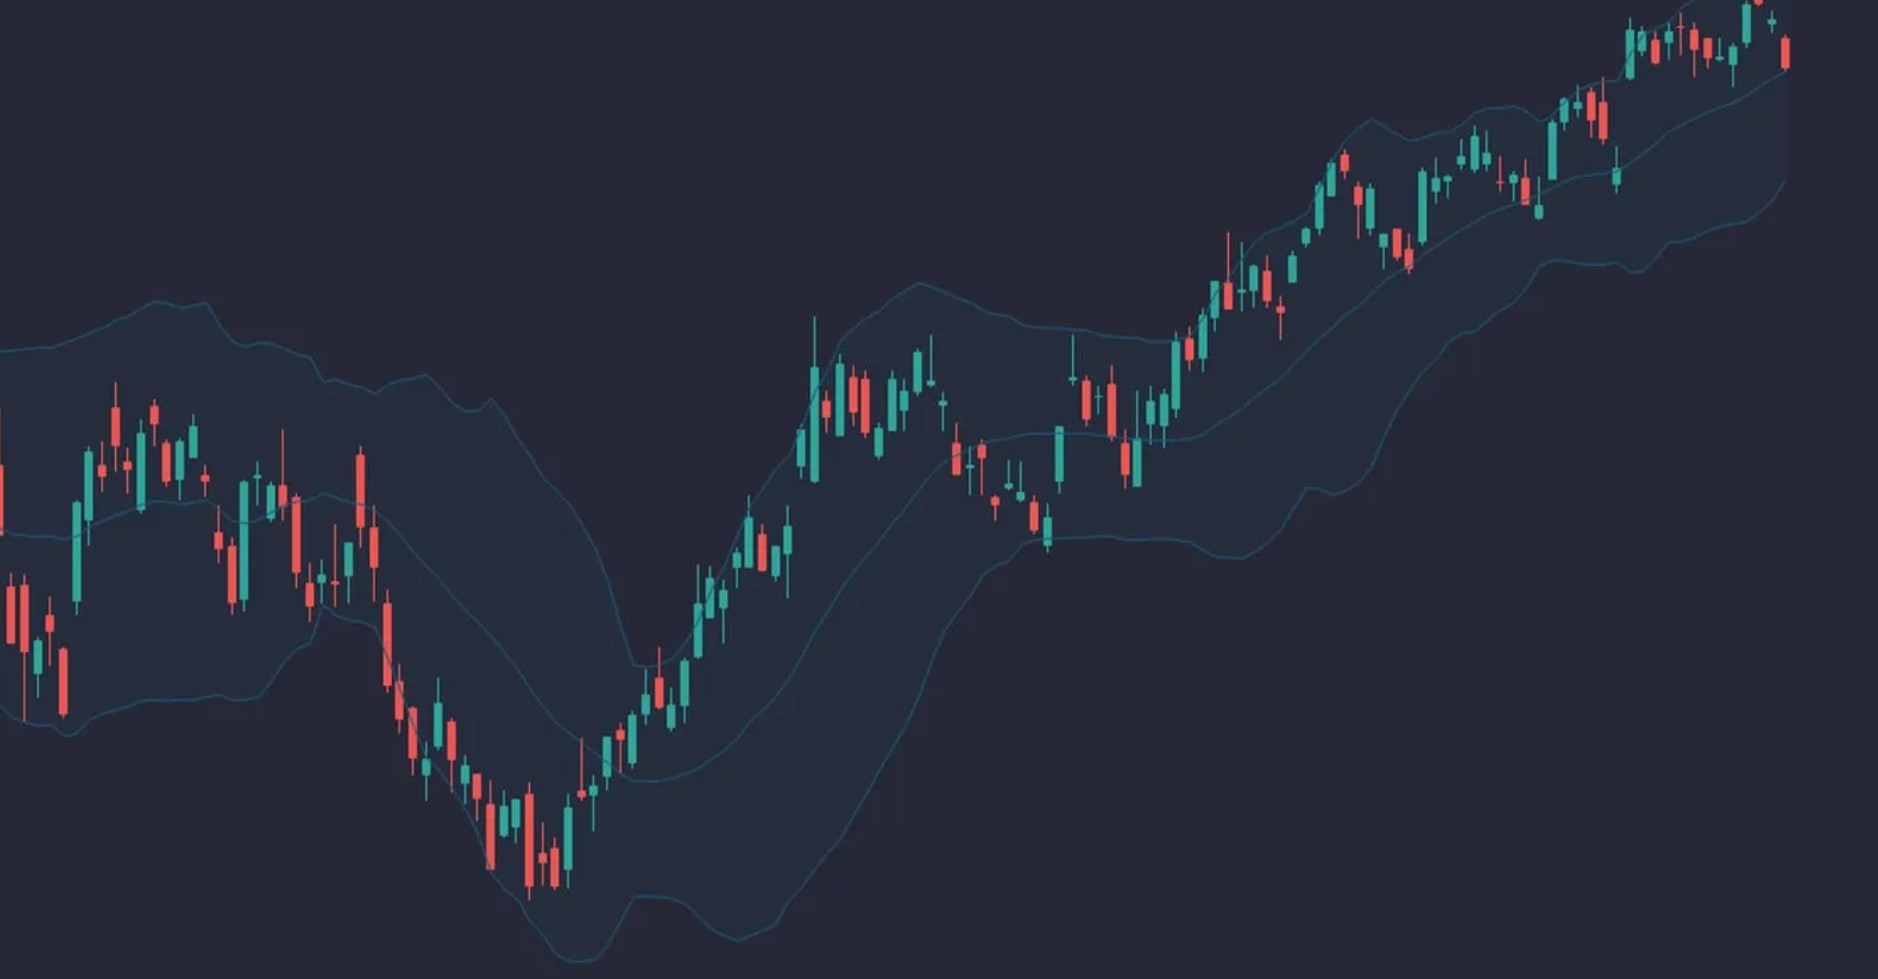
Bollinger Bands, created by renowned technical analyst John Bollinger, are a popular volatility indicator used by traders to analyze price movements and identify potential trade setups. The bands consist of three lines plotted on a price chart: the middle band, upper band, and lower band. The middle band is typically a 20-day simple moving average (SMA), while the upper and lower bands are calculated based on the standard deviation of price fluctuations.
The Components of Bollinger Bands
To better understand Bollinger Bands, let’s break down the components:
- Middle Band – The middle band represents the 20-day simple moving average (SMA) and acts as the baseline for the other bands. It provides a visual reference for the average price over a specific period.
- Upper Band – The upper band is calculated by adding two standard deviations to the middle band. It serves as a resistance level, indicating potential overbought conditions.
- Lower Band – The lower band is derived by subtracting two standard deviations from the middle band. It acts as a support level, highlighting potential oversold conditions.
Interpreting Bollinger Bands
Bollinger Bands offer valuable insights into market volatility and price trends. Traders can interpret Bollinger Bands in various ways to identify potential trading opportunities:
Trend Identification
By observing the price movements relative to the Bollinger Bands, traders can determine the market’s overall trend. When prices are consistently trading near the upper band, it indicates an uptrend, while prices near the lower band suggest a downtrend. Periods of consolidation or ranging markets are often characterized by prices oscillating between the upper and lower bands.
Volatility Assessment
Bollinger Bands expand and contract based on market volatility. Wider bands suggest higher volatility, while narrower bands indicate lower volatility. Traders can use this information to gauge potential breakout or reversal opportunities.
Overbought and Oversold Conditions
When prices touch or exceed the upper band, it indicates potential overbought conditions, suggesting a reversal or pullback may be imminent. Conversely, when prices touch or fall below the lower band, it suggests potential oversold conditions, indicating a potential rebound in price.
Strategies for Using Bollinger Bands
Now that we have a solid understanding of Bollinger Bands and how to interpret them, let’s explore some effective strategies for incorporating them into your trading approach.
1. Bollinger Squeeze Strategy
The Bollinger Squeeze strategy is commonly used to identify periods of low volatility and anticipate potential breakouts. When the Bollinger Bands contract and the distance between the upper and lower bands narrows significantly, it signifies a period of low volatility. Traders can prepare for potential breakouts by closely monitoring the price action during these squeeze phases.
2. Bollinger Breakout Strategy
The Bollinger Breakout strategy aims to capture price movements following periods of low volatility. When prices break out of the Bollinger Bands, it suggests a potential trend reversal or continuation. Traders can enter long or short positions based on the direction of the breakout, accompanied by confirming indicators or candlestick patterns.
3. Bollinger Trend-Following Strategy
The Bollinger Trend-Following strategy is ideal for traders looking to ride established trends. When prices consistently hug the upper or lower band, it indicates a strong trend. Traders can enter positions in the direction of the trend, employing additional tools or indicators to confirm the validity of the trend.
4. Bollinger Reversal Strategy
The Bollinger Reversal strategy aims to identify potential reversal points in the market. When prices touch or exceed the outer bands, it suggests overbought or oversold conditions. Traders can anticipate a reversal in price and enter counter-trend positions, provided other confirming indicators support the trade setup.
FAQs
1. What timeframes are suitable for using Bollinger Bands?
Bollinger Bands can be effectively utilized across various timeframes, from intraday trading to longer-term investing. However, the optimal timeframe depends on your trading style and objectives. Shorter timeframes like 5-minute or 15-minute charts are popular among day traders, while swing traders often focus on hourly or 4-hour charts.
2. Can Bollinger Bands be used with other technical indicators?
Absolutely! Bollinger Bands can be combined with other technical indicators to strengthen trade signals and increase the probability of successful trades. Commonly used indicators in conjunction with Bollinger Bands include the Relative Strength Index (RSI), Moving Average Convergence Divergence (MACD), and Stochastic Oscillator.
3. How do I set the parameters for Bollinger Bands?
The default parameters for Bollinger Bands are a 20-day SMA and two standard deviations. However, these settings can be customized to suit individual preferences and trading strategies. Traders can experiment with different time periods and standard deviation values to find the optimal combination for their specific needs.
4. Are Bollinger Bands effective in all market conditions?
While Bollinger Bands are a powerful tool, it’s essential to note that no indicator guarantees success in all market conditions. Like any technical analysis tool, Bollinger Bands provide insights and probabilities, but traders should combine them with other forms of analysis and risk management techniques for a well-rounded trading approach.
5. Can Bollinger Bands be applied to non-financial markets?
Yes, Bollinger Bands can be applied to various markets beyond stocks and forex. They can be used in commodities, cryptocurrencies, and other financial instruments where price volatility is present. Traders should adjust the parameters accordingly to accommodate the specific market they are trading.
6. How do I determine stop-loss and take-profit levels when using Bollinger Bands?
Stop-loss and take-profit levels should be determined based on the trader’s risk tolerance, market conditions, and the specific trade setup. One approach is to set stop-loss orders just beyond the outer bands to limit potential losses if the trade goes against you. Take-profit levels can be established based on key support and resistance levels or by using trailing stops to capture profits as the trade moves in your favor.